Saturday 28 December 2013

MERRY CHRISTMAS & HAPPY NEW YEAR 2014 !!!!

How are your trades? Anyone have any open positions?
Check out GBPUSD since the last post, hanging up there. Let's wait and see what 2014 will be. Cheers!

Saturday 23 November 2013


GBPUSD 24 Nov 2013 Daily chart review
Well been busy lately with work. No time to post.
Anyway, GBPUSD is holding up nicely its BUY Signal [which if you remember my entry was exited by SL 200 :( ]

EURUSD has no new signal.
USDCHF has a haywire signal, which i am not going to discuss.

USDJPY maintaining its uptrend, but the sizzle may died soon.
Until then, happy trading!


Friday 8 November 2013


8 Nov 2013 GBPUSD Daily review
Are you kidding me? For those few lucky ones which their SL200 did not trigger, get ready for a ride of your life. GBPUSD has potential to continue trend up.
Remember, when there is opportunity, please move your SL to breakeven level at least.
As for me, my SL200 was hitted so I am out of this trade. Good luck to others!

Friday 1 November 2013


2 November 2013 EURUSD Daily
Let us recap.

Refer to my last post on 17 Oct 2013.
Entered 1.35410 with SL 1.33410
Price peak on 27 Oct 2013 at price of 1.3808 (floating gain 267 pips)

Price drops at recent close at 1.34857 (floating loss 55 pips or whichever SL you have modified)

Be prepared for further drop. I will not continue comment on this entry anymore as I will assume most would have exited. Thank you.

Thursday 31 October 2013


GBPUSD Daily
Continuing from my previous post on GBPUSD Daily - a BUY Signal with SL200
Well not sure you guys entered late, but i entered quite early (oops) at 1.62076 with SL 200 of 1.60076
My SL 200 was hit. Guess is not a good idea to enter to early. Oh well at least my SL is setted.

Let us see if they is any rebound upwards. For those whose SL200 remain intact, good luck to you.

Sunday 27 October 2013

GBPUSD Daily
Okay guys, it is getting closer to BUY signal for GBPUSD.
If GBPUSD can maintain its upward motion, the signal will be turn on any hour now.
Remember SL 200 for your own safety. Until then, let us wait and see.


Okay, latest update confirmed is a BUY signal. Enter now!
Remember to set SL200 or whatever figure you are comfortable. Let us see where this leads us in the next coming weeks. Good luck!


27 Oct 2013 GBPUSD 4 Hour review.
I am not going into detail analysis of the pass signals.
Let us focus on the most recent one which will be very.....interesting.

15 Aug 2013 BUY - late entry 1.56902 on 21 Aug 2013 with SL 200 as usual.
Price dip a low 1.54236 on 28 Aug 2013 of which our SL 200 has been hitted, Too bad!

Now price is still trending upwards, and looking at Daily chart in my previous post we have not any BUY signal yet. What does that means?? Daily BUY signal will comes soon...so get your SL200 pips ready to be sacrificed!

Once the daily signal triggered a BUY, i will try post it as soon as I can. Hopefully you guys will see it 'real-time' where will the Daily BUY signal leads you to. Either SL200 or a gain?

Good luck!


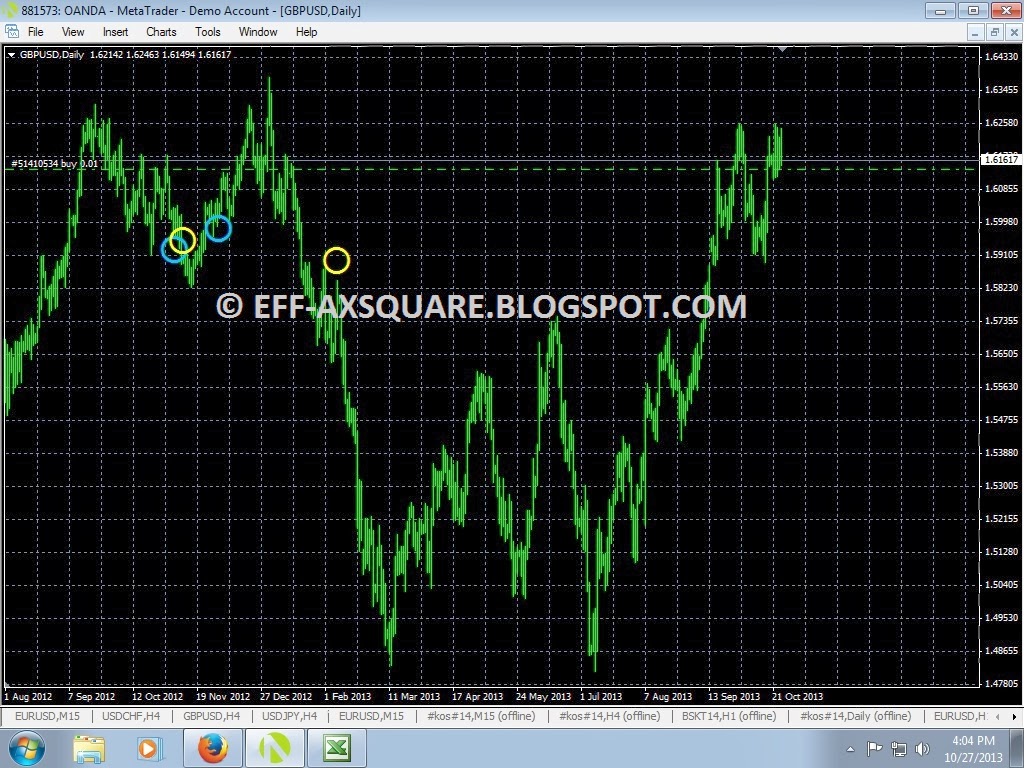
27 Oct 2013 A peek at GBPUSD Daily chart.
6 Nov 2012 BUY signal but entered late on 8 Nov 2012 at price of 1.60062 with SL 200
11 Nov 2012 SELL signal (dang!) but entered late on 14 Nov 2012 at price of 1.58458 with SL 200
Price hit a low of 1.58269 on 15 Nov 2012 which is far away from our SL200 for 6 Nov 2012.
2 Dec 2012 BUY signal again (this is nuts!) entered late on 4 Dec 2012 at 1.61146 with SL200.

1 Jan 2013 price hits a high of 1.63793.
On this date:
6 Nov 2012 BUY - floating gain 370+ pips
11 Nov 2012 SELL - floating loss 530+ pips (of which SL 200 pips triggered!!)
2 Dec 2012 BUY - floating gain 260+ pips
Net floating gain 430+ pips

Wow. But worst case scenario, we are greedy, we held on to all our pairs. Let us see what happens next!
8 Feb 2013 SELL signal, entry late 1.55215 on 13 Feb 2013.

12 March 2013 price dip to low of 1.48304
On this date:
6 Nov 2012 BUY - floating loss 1170+ pips (SL200 would have triggered!!)

2 Dec 2012 BUY - floating loss 1280+ pips (SL200 would have triggered!!)
8 Feb 2013 SELL - floating gain of 690+ pips

Now some of you would have moved SL position to Break Even.
But let us assume in worst case scenario, we held on our original SL200.
What is my net position on 12 March 2013?
Net gain of 90+ pips (-200 -200 -200 +690)
Not too shabby. Next post will be an exciting one!!! Stay tune!!!

Friday 25 October 2013


USDJPY review 25 October 2013:
As mentioned last week, here is a look at USDJPY daily signals.
Buy signal on 7 Jan 2013, entry late of 86.822 with SL 200 pips at 84.822
17 May 2013 prices close a high of 103.186 (a floating gain of 1630 pips!)
As of time of this writing my USDJPY hovering at 97.301 (floating gain of 1047 pips!)
So far original SL 200 was never touched. I am sure by now most people would have moved their SL to at least break even or some would have bail out long time ago. No one would be 'brave' to hold on their trades for about 10 months.


Now let us have a look at 4H chart.
23 May 2012 SELL signal, entered late 79.762 with SL 200 at 81.762
Price hit a high 80.614 on 24 June 2012 - SL still not breached
Price hit a low 77.526 on 13 Sep 2012 (floating gain of 220 pips approximately)
Assume we are greedy we did not do anything - oh dear! our SL 200 was finally breached on 20 Nov 2012.

But there was a BUY signal on 24 Oct 2012, late entry on 2 Nov 2012 at 80.531 with SL 200 at 78.531
As above in Daily chart, price of USDJPY continue to trend up with a high on 17 May 2013 of 103.186 (floating gain of 2260 pips!!).

Not a bad pair to trade or risk 200 pips. Happy trading all!!


Saturday 19 October 2013


4H of USDCHF review
14 June 2013 SELL - assume we entered late at 0.92552 with SL 200
9 July 2013 reaches high of 0.97504 (495 pips lost so SL200 definitely hitted)

3 July 2013 BUY - assume we entered late at 0.95698 with SL 200
As above price went high on 9 July 2013 of 0.97504 (180 pips gain - bail now or reset your SL)

26 July 2013 SELL - late entry at 0.93077 with SL200
6 Sep 2013 reaches high of 0.94547 (147 pips of floating loss)

Recent close of 0.9013 (294 floating pips gain)

Looks like 4H is better for USDCHF - less false signals.

So that's all for this week folks. Cheers!


A distant relative of EURUSD...
Ok, as posted earlier i will be looking at other major pairs. Let's begin with USDCHF, i call it a distant relative of EURUSD simply because it is negatively-correlated with EURUSD.
Anyway, the above shows daily signals for USDCHF recent months.

What can i say? It seems to be worst performing than EURUSD. Let us analyse:
30 May 2013 a Buy signal, but assume we entered late 0.95243.
Price went south 0.91296 (394 pips! so is goodbye to this entry if SL200 pips was setted)

12 June 2013 a Sell signal, assume we entered late so at low of 0.91664.
BOOM! The price went up again! What a joke! It went to 0.97504 (584 pips lost!! 200 pip SL again triggered)

12 July 2013 a Buy signal, we entered late at 0.94373 but then later on...
24 July 2013 a Sell signal again! Assume entry is late at 0.92882
Well, at this point you have 2 options, to close out 12 July 2013 entry and enter a Sell or you can leave the 12 July 2013 with the SL 200 pips.
So assume we are greedy, we leave our 12 July 2013 Buy with SL200 intact and also enter the 24 July 2013 Sell.
Prices continue trend down to 0.90130 recent closing.
12 July 2013 Buy 0.94373 (424 pip lost, so definitely 200 pip loss bagged)
24 July 2013 Sell 0.92882 (275 pip floating gain)

Wow, what a roller coaster ride for USDCHF. We have 600 pips lost and a floating 275 pip gain. Bummer.
Next we see how does 4H fair for this pair.

Friday 18 October 2013

You can visit me at Facebook too ^^

https://www.facebook.com/effax.effax?fref=ts

Not sure the link works. In case, just search for Effax Effax.

Cheers!

Thursday 17 October 2013


Early weekly review
18 Oct 2013
Well, what do we have here.
EURUSD went up to a high of 1.36815 (floating gain of 140 pips approximately)
No sign of our earlier SL 200 pips at 1.33410 being touch.
For those who still have this opened, i suggest you moved your SL to secure at least a Break Even for yourself.
For those not greedy, get out now and pocket your pips.

Now as per my earlier post on the 4H, we were holding onto our earlier entry 1.32176.
Prices peak at 1.36815 (approx floating gain of 460 pips)
Not bad for risk of 200 pips SL setted earlier.
Again, you have choice to bail out or set whatever new SL you are comfortable with.
You could use Trailing Stops (TS) at this point onwards since you would not be monitoring it anymore with your SL secured at positive pips.


See you all next week! If time permits, lets explore other major pairs like USD/CHF, USD/JPY and GBP/USD. But for those who are comfortable with EUR/USD, please stick to it.


Monday 14 October 2013


Okay, been really quiet looking at Daily chart. But that is what is all about, set and forget since SL 200 pips have been set.
Now let us look at 4 Hour charts just to spice things up.
But be warned, 4H chart can have more false triggers signal than daily.
7th July a SELL signal, as usual in worst case scenario we entered late at lowest point of 1.28080.
9th July reaches peak of 1.28977, a floating loss of 90 pips!!!
If you have set a SL 200 pips, this is still in your safety zone.
Next few candles the price plummets down to 1.27731 (potential gain of 34 pips)
But lets assume we panicked and close out at 90 pips of loss : )

The next BUY signal is interesting on 22 July - again in worst case we entered late at peak of 1.32176
Say SL of 200 pips setted (1.30176)
Price reaches low of 1.31042 on 6 September (floating loss of 113 pips - still in safe zone)
On 3rd October it reaches 1.36402 (a whopping 422 pips!! Bail out now or set Trailing Stops)
Ofcourse this 4H signal will be much earlier than D1 signals.

Lets assume we are greedy and we still hold on to this position till today, probably some of us would have move SL to break even point. Lets wait and see!

Friday 11 October 2013


Weekly review 12 Oct 2013
Lets recap our earlier entry weeks ago.
We entered 1.35410
SL setted at 1.33410

Lowest: 1.34847 (SL no hit)
Highest: 1.36066 (float gain 65 pips approximately)
Close: 1.35349 (float loss 6 pips approximately)

Looks like still holding on.
For those who lucky to be in front of screen you would have probably exited.
For those who 'set and forget', let us continue and ride on till next week. See ya!

Saturday 5 October 2013


Weekly Review
5 Oct 2013
Alrighty, lets see.
Price hits a high of 1.36457 (compared that to our entry of 1.35410 = approx 100 pips gain!)
Those who lucky enough to watch the market all the time could have bag this in.
Closing at 1.35537, so for those less fortunate with less time to monitor market, you are about 12 pip gain.
Stop Loss remain at 1.33410.
Looking at the trend line we are still good in "trending up mode"
Let us again wait and see if this Stop Loss hold its fort for the following week. Good luck!


Friday 27 September 2013


Weekly Review
28 Sep 2013
Daily Chart
Okay, let's recap on our last signal and SL setted from last week.
Entry at 1.35410
SL setted at 1.33410
The lowest price for the week hits at 1.34611. That means our SL is safe, not triggered.
The highest price did hit 1.35640 (roughly floating gain 20 pips plus)
Last close 1.35141 (roughly floating loss of 27 pips)
At this point, you can choose to be:
i) panic mode and closed the trade when market re-opens
ii) stay cool since you got your SL
iii) or modify SL
iv) add a trailing stop
Choice is yours.
As for me, i just wait and see. Since SL of 1.33410 will be the loss that i can 'afford' to lose.
Let us see what will next week be. Until then...see ya!


Week 20 Sep 2013 review
Daily Chart
BUY on 18 Sep 2013
Entry: 1.35410 (assuming we enter late i.e. only after the huge surge in price)
SL: 1.33410 (200 pips or whatever loses you can 'afford')

Let's see what happens in a week's time, whether our SL will be triggered or not. See Ya!!